前言
这是之前在 生产环境碰到的一个问题
这个其实就是 业务上一个地图点击点位展示详情, 然后再点击另外一个点位 展示详情, 切换中心店的这个过程
其主要的问题是 使用 openlayers 的 Map.View.setCenter() 了之后, 整个地图的中心点切换到了一个莫名其妙的地方
然后 经过大量的事件排查, 我们发现 在我们复现问题的操作的过程中总共有两个地方在进行中心点的切换
第一个是我们业务上的 map.getView().setCenter(), 然后另外一个是 openlayers 的 Overlay 元素的重新绘制 的过程中的一个中心点的切换
然后 正常的业务情况是 先执行 Overlay 的相关业务绘制, 然后再执行 map.getView().setCenter()
然后 在我们这里测试出了某一个情况下 业务代码这边先执行的 map.getView().setCenter() 然后再执行的 Overlay 的相关业务绘制, 然后导致 地图上面看不到数据, 产生了一个 bug, 就是 我点击了目标点位, 期望地图上面能够展示这个点, 以及这个点位的详情信息, 但是实际情况是 地图上面展示的是空的
我们这里 便是来看一下 这个问题
测试用例
<template>
<div style="width: 1920px; height:1080px;" >
<div class="olMapUsageClass"></div>
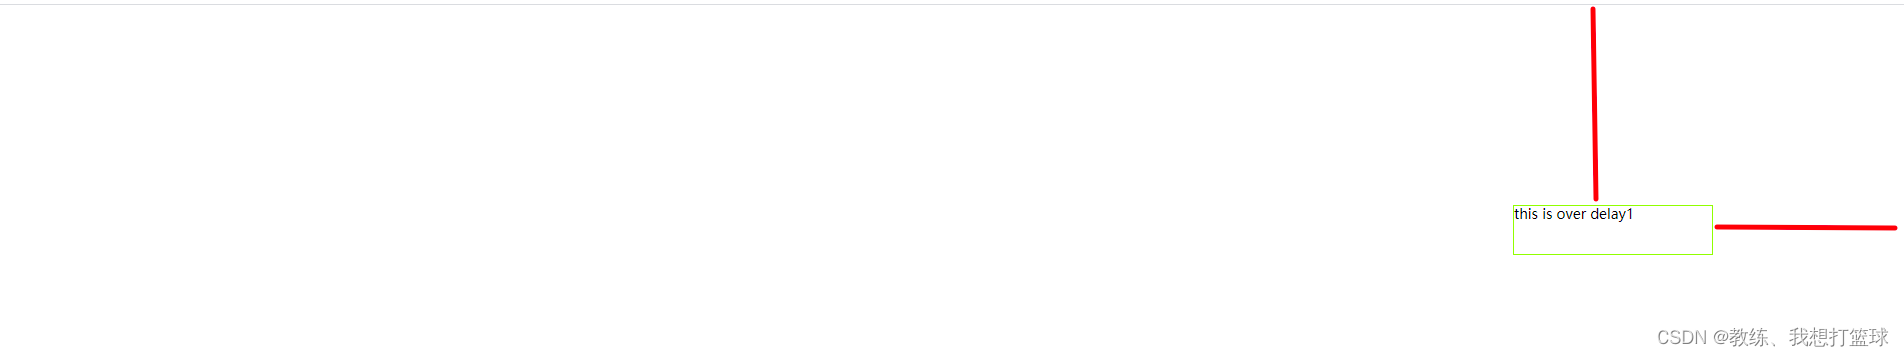
<div class="overdelay1" ref="overdelay1" >
this is over delay1
</div>
</div>
</template>
<script>
import Map from 'ol/Map'
import View from 'ol/View'
import DragPan from 'ol/interaction/DragPan'
import MouseWheelZoom from 'ol/interaction/MouseWheelZoom'
import PointerInteraction from 'ol/interaction/Pointer'
import GeoJSON from 'ol/format/GeoJSON'
import {Tile as TileLayer} from 'ol/layer'
import {Vector as VectorLayer} from 'ol/layer'
import {Image as ImageLayer} from 'ol/layer'
import {Vector as VectorSource} from 'ol/source'
import {Feature as Feature} from 'ol'
import Point from 'ol/geom/Point'
import LineString from 'ol/geom/LineString'
import Polygon from 'ol/geom/Polygon'
import CircleGeo from 'ol/geom/Circle'
import XYZ from "ol/source/XYZ"
import ImageStatic from "ol/source/ImageStatic"
import {Circle, Fill, Icon, RegularShape, Stroke, Style, Text} from 'ol/style'
import Overlay from 'ol/Overlay'
import {transformExtent, transform} from "ol/proj"
export default {
name: "olMapUsage",
components: {},
props: {},
data() {
return {
map: null,
tdtImgLayer: null,
labelLayer: null,
overlay: null,
};
},
computed: {},
watch: {},
created() {
},
mounted() {
this.initMap()
this.test12SetCenterThenAddOverlay()
},
methods: {
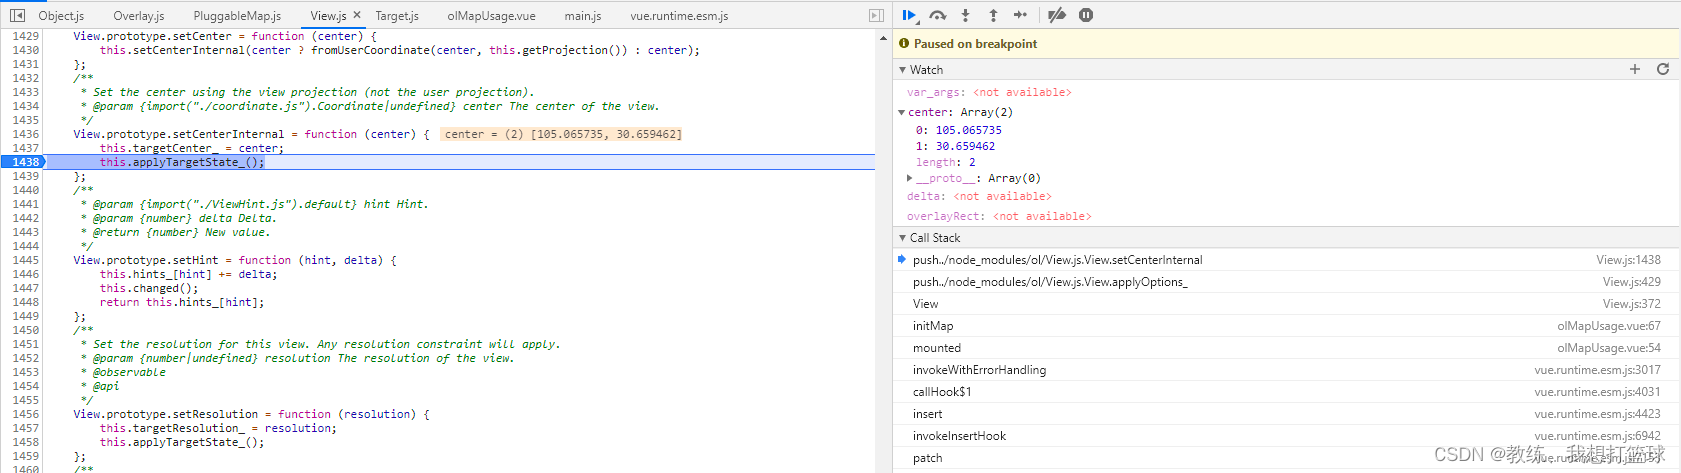
initMap() {
let center = [105.065735, 30.659462]
let projection = "EPSG:4326"
let zoom = 10
let minZoom = 5
let maxZoom = 20
const layer = []
const view = new View({
...(this.viewOptions || {}),
projection,
center,
zoom,
minZoom,
maxZoom
})
this.map = new Map({
...(this.mapOptions || {}),
layers: [].concat(layer),
view: view,
target: this.$el,
controls: [],
interactions: [
new DragPan(),
new MouseWheelZoom(),
new PointerInteraction({
handleEvent: this.handleEvent
})
]
})
},
test06AddCircleLayer(coord, color) {
color = color || 'green'
let style = new Style({
image: new Circle({
radius:20,
fill: new Fill({
color: color
})
})
})
let feature = new Feature({
geometry: new Point(coord)
})
feature.setStyle(style)
let source = new VectorSource()
source.addFeature(feature)
let layer = new VectorLayer({
source: source
})
this.map.addLayer(layer);
},
test10SetCenter(coord, color) {
this.map.getView().setCenter(coord)
this.test06AddCircleLayer(coord, color)
},
test11AddOverlay(coord) {
this.overlay && this.map.removeOverlay(this.overlay)
this.overlay = new Overlay({
element: this.$refs.overdelay1,
position: coord,
positioning: "bottom-center",
offset: [0, 0],
autoPan: true,
autoPanMargin: 200,
autoPanAnimation: {
duration: 1000
},
map: this.map
})
this.map.addOverlay(this.overlay)
},
test12SetCenterThenAddOverlay() {
// refer cycle
this.test06AddCircleLayer([10.265735, 10.659462], "#007f5a")
this.test06AddCircleLayer([105.565735, 30.759462], "#0039ff")
let _this = this
// use this for map.addOverlay's animation update
setTimeout(function() {
_this.test11AddOverlay([10.065735, 10.459462])
_this.test10SetCenter([10.065735, 10.459462], "yellow")
}, 2000)
// the core case, normal or exception or compensated
setTimeout(function() {
// case1. function of addOverlay
_this.test11AddOverlay([105.065735, 30.259462])
// case2. normal case
// _this.test11AddOverlay([105.065735, 30.259462])
// _this.test10SetCenter([105.065735, 30.259462], "red")
// case3. exception case
// _this.test10SetCenter([105.065735, 30.259462], "red")
// _this.test11AddOverlay([105.065735, 30.259462])
// case4. compensated case
// _this.test10SetCenter([105.065735, 30.259462], "red")
// setTimeout(function() {
// _this.test11AddOverlay([105.065735, 30.259462])
// }, 1000)
}, 5000)
},
}
};
</script>
<style lang="scss">
.olMapUsageClass {
}
.overdelay1 {
position: absolute;
border: 1px greenyellow solid;
width: 200px;
height: 50px;
}
</style>map.addOverlay 的绘制和计算
这里使用 上面的 case1 的相关代码 来查看
整个测试用例分为了三次状态, 第一个是初始状态, 第二个是 切换到 [10.065735, 10.459462] 附近, 第三个是切换到 [105.065735, 30.259462] 附近
我们这里 着重关注 第三次切换
我们上面配置的 Overlay 的 autopan 相关配置为 margin 为 200, duration 为 1s, 我们这里是从做下切换到右上, 因此 overlay1 是距离右上 200px, 然后整个切换的耗时为 1s
注意这里 Overlay 的 autopan 切换的中心点不是将 Overlay 放在正中间, 只需要满足 autopanMargin 的配置即可
我们可以将 autopanMargin 配置调整下, 再看下一个大概的情况, autoPan 只需要确保给定的元素在页面上能够找到即可
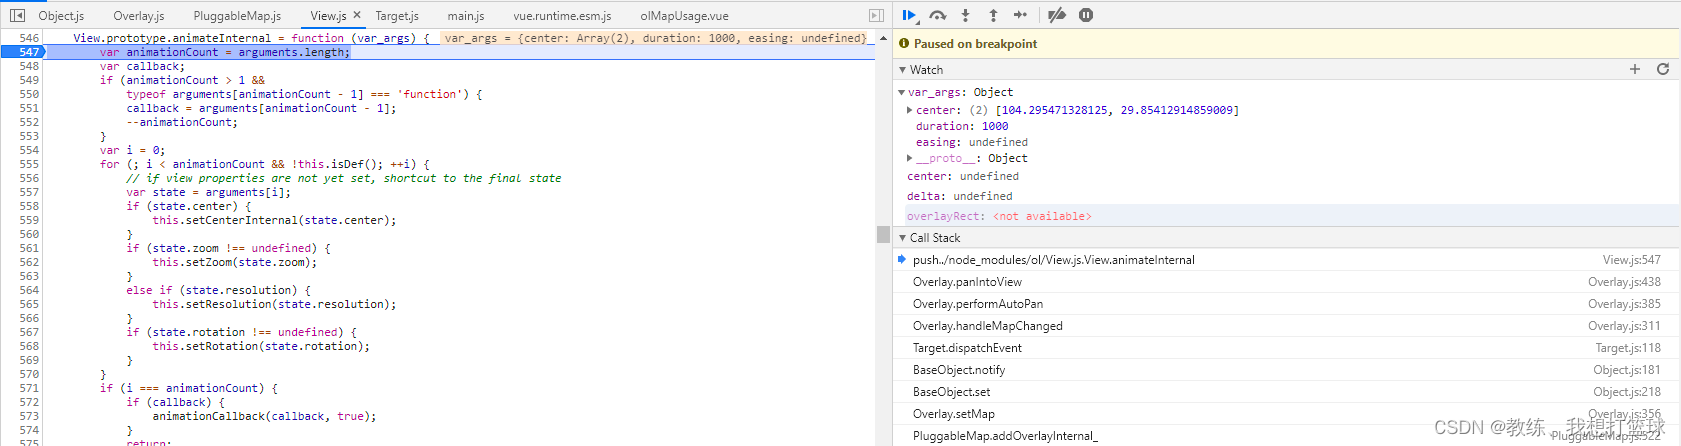
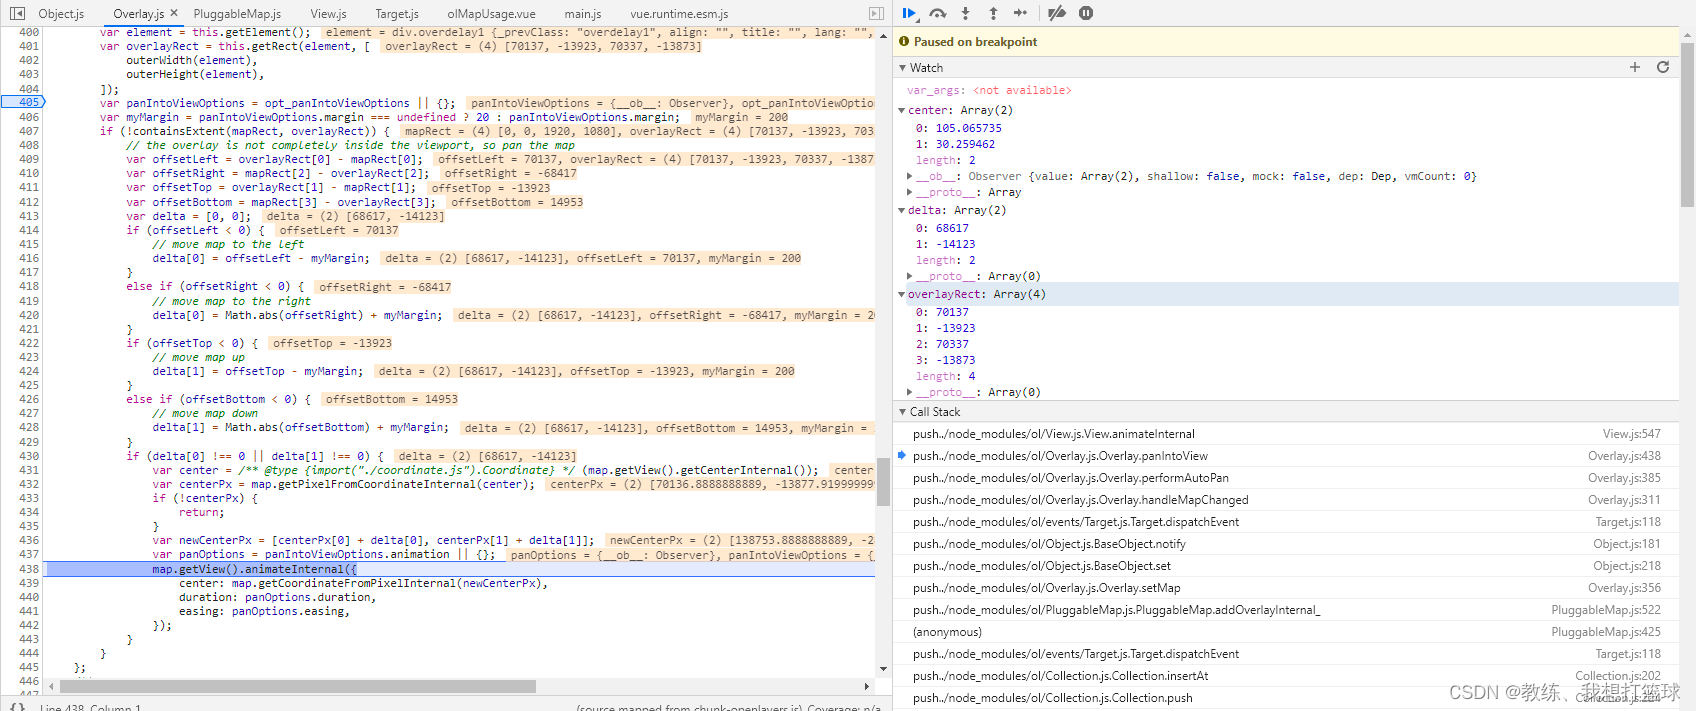
然后 autopan 目标中心点计算方式如下
这里 newCenterPx 的计算涉及到两个变量, 其一是 center, 即 map.getView().getCenter 为当前的 [10.065735, 10.459462]
另外一个 delta 计算结果为 [68617, -14213]
delta 的计算依赖于 overlayRect, 值为 [70137, -13923, 70337, -13873]

然后最终 计算出来新的中心点为 [104.29, 29.85]
保证的是 center 切换到新的中心点的时候 可以看到 [105.065735, 30.259462] 的 Overlay

正常绘制 以及 切换中心点的情况
这里切换到 case2 来执行
会先执行 Overlay 然后再执行 map.getView().setCenter
Overlay 的 autopan 这个阶段, 可以看到和上面是一样的, 然后设置中心点为 [104.29, 29.85], 以及动画切换
然后接着是 setCenter 的处理, 设置中心点为 [105.065735, 30.259462] 然后渲染
这样最终的效果如下, center 为 点位的位置, 以及 overlay所在的位置

异常绘制 以及 切换中心点的情况
这里切换到 case3 来执行
会先执行 map.getView().setCenter 然后再 执行 Overlay
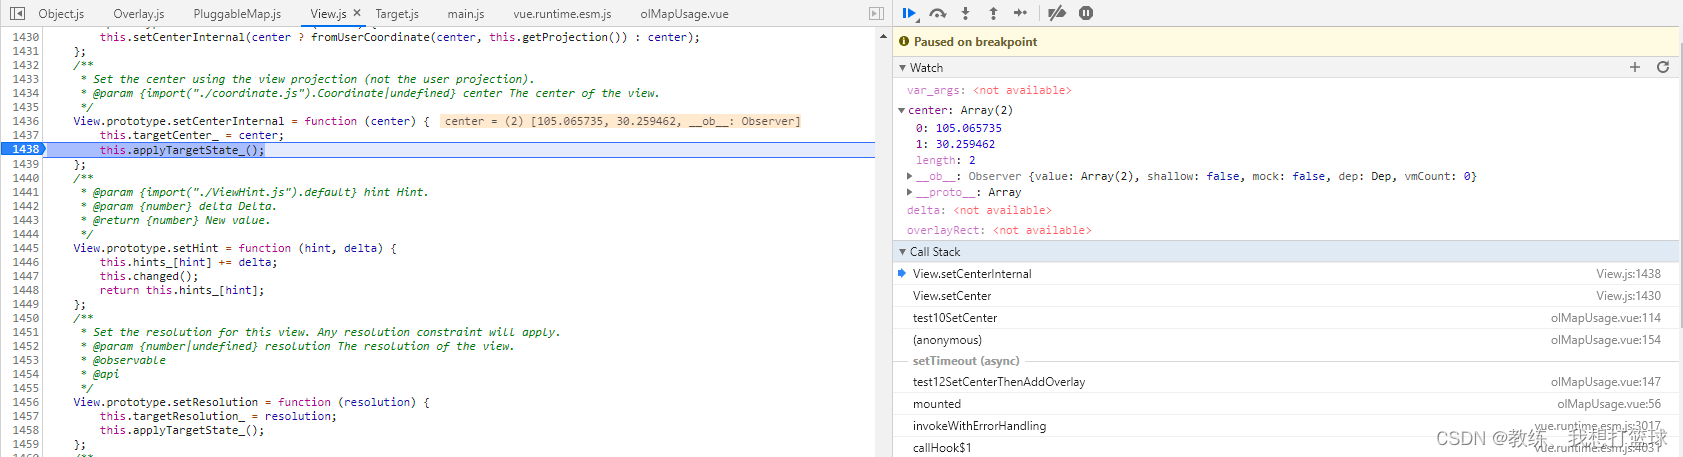
map.getView().setCenter
map.getView().setCenter 之后, 设置了 map 的中心点的字段为 [105.065735, 30.259462]
然后接下来的 applyTargetState 才会开始真实的数据的渲染, 切换
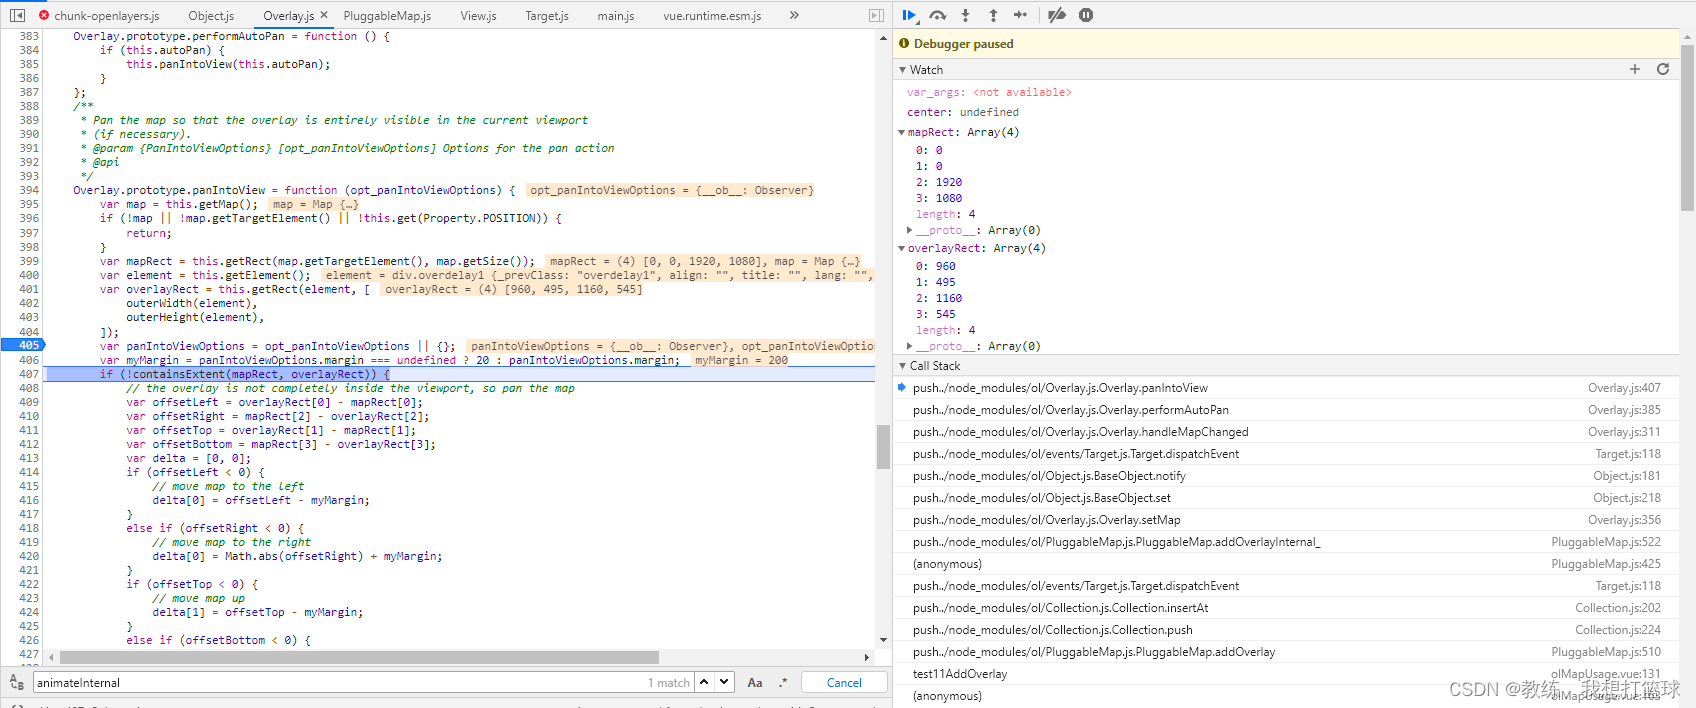
Overlay 的 autopan 这个阶段
然后 autopan 目标中心点计算方式如下
这里 newCenterPx 的计算涉及到两个变量, 其一是 center, 即 map.getView().getCenter 为当前的 [105.065735, 30.259462]
另外一个 delta 计算结果为 [68617, -14213]
delta 的计算依赖于 overlayRect, 值为 [70137, -13923, 70337, -13873]
可以看到 和上面正常的 Overlay 加载的时候会存在一些问题
第一 center 变化了, 拿到的 overlayRect 还是 [10.065735, 10.459462] 状态下的 overlayRect, 然后计算出的偏移也是 [10.065735, 10.459462] 相比于 [105.065735, 30.259462] 的偏移
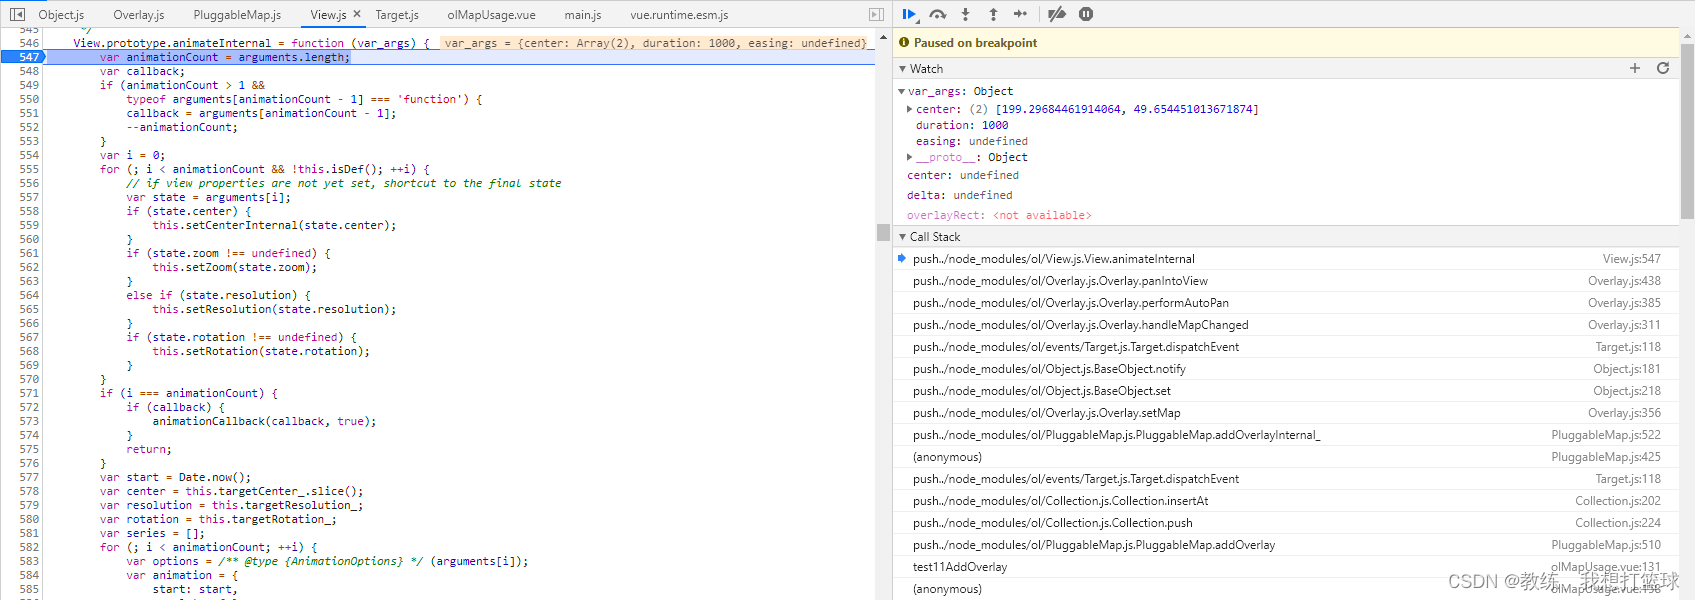
然后 导致了计算中心点存在问题, 最终 autopan 切换到目标中心点之后, 切换到了一个错误的中心点, 导致页面看不到数据
然后 我们大致推导一下 这个新的中心点
从上面 map.addOverlay 中我们可以看到 delta 对应的经纬度偏移大致为 [104.29-10.06, 29.85-10.45], 即为 [94.23, 19.4]
然后 大致的新的中心点位为 [105.065735+94.23, 30.259462+19.4] 为 [199.29, 49.65]
可以看到 和我们的推导一样
综上 核心问题就是, map.getView().setCenter 之后先切换了 map.view 的中心点的数据
但是 View.applyTargetState 的过程是异步的
Overlay 的Overlay.panIntoView 中 this.getRect(element, [outerWidth(element),outerHeight(element),]); 获取到的元素状态为 中心点为 [10.065735, 10.459462] 的状态下面的元素状态
然后一个是 最新的中心点位, 一个是基于 旧的中心点位元素状态计算的偏移, 然后 最终得到了一个 错误的结果
如何先切换中心点 然后再绘制 Overlay
然后 这里的一个 曲线救国的调整方式就是, 在 setCenter 渲染结束了之后, 在添加 Overlay, 调整的方式如下
// case4. compensated case
_this.test10SetCenter([105.065735, 30.259462], "red")
setTimeout(function() {
  _this.test11AddOverlay([105.065735, 30.259462])
}, 1000)
然后 我们这里看一下 我们这里的 Overlay 的添加情况, 这会是 另外的一个状态
切换了中心点之后, 然后再执行 test11AddOverlay 的时候, 会发现 Overlay 的坐标在当前上下文的区域内, 不用进行 autopan, 直接跳过了 autopan 的流程
完