首先封装Echart一个文件 代码如下
js"><script setup lang="ts">
import { ECharts, EChartsOption, init } from 'echarts';
import { ref, watch, onMounted, onBeforeUnmount } from 'vue';

// 定义props
interface Props {
  width?: string;
  height?: string;
  option: EChartsOption;
}
const props = withDefaults(defineProps<Props>(), {
  width: '100%',
  height: '100%',
  option: () => ({})
});

const myChartsRef = ref<HTMLDivElement>();
let myChart: ECharts;
// eslint-disable-next-line no-undef
let timer: string | number | NodeJS.Timeout | undefined;

// 初始化echarts
const initChart = (): void => {
  if (myChart !== undefined) {
    myChart.dispose();
  }
  myChart = init(myChartsRef.value as HTMLDivElement);
  // 拿到option配置项,渲染echarts
  myChart?.setOption(props.option, true);
};

// 重新渲染echarts
const resizeChart = (): void => {
  timer = setTimeout(() => {
    if (myChart) {
      myChart.resize();
    }
  }, 500);
};

onMounted(() => {
  initChart();
  window.addEventListener('resize', resizeChart);
});

onBeforeUnmount(() => {
  window.removeEventListener('resize', resizeChart);
  clearTimeout(timer);
  timer = 0;
});

watch(
    props.option,
    () => {
      initChart();
    },
    {
      deep: true
    }
);
</script>
<template>
  <div ref="myChartsRef" :style="{ height: height, width: width }" :option="option" />
</template>
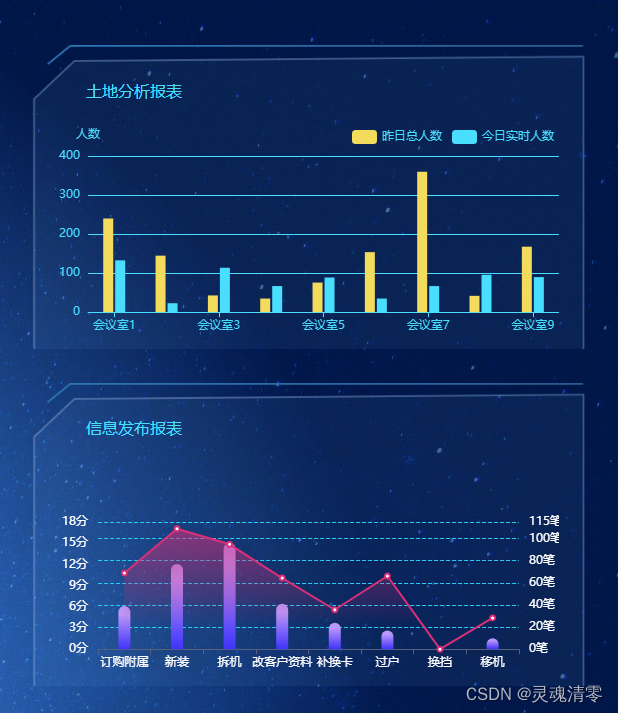
第一一个案例代码如下 需要引入我们封装好的 Echart.vue文件
js"><script setup lang="ts">
import { reactive } from 'vue';
import Echarts from './index.vue';

const option = reactive({
  tooltip: {
    trigger: 'axis',
    axisPointer: {
      type: 'shadow',
      label: {
        show: true
      }
    }
  },
  grid: {
    left: '6%',
    top: '15%',
    right: '0',
    bottom: '10%'
  },
  legend: {
    data: ['昨日总人数', '今日实时人数'],
    top: '0',
    color: '#4ADEFE',
    fontSize: 14,
    selected: { 昨日使用率: false }, // 不需要显示的设置为false
    textStyle: {
      color:'#4ADEFE',
    },
    x : 'right',
    y : 'top',
  },
  xAxis: {
    data: [
      '会议室1',
      '会议室2',
      '会议室3',
      '会议室4',
      '会议室5',
      '会议室6',
      '会议室7',
      '会议室8',
      '会议室9'
    ],
    axisLine: {
      show: true, //隐藏X轴轴线
      lineStyle: {
        color: '#4ADEFE',
        width: 1
      }
    },
    axisTick: {
      show: true, //隐藏X轴刻度
      alignWithLabel: true
    },
    axisLabel: {
      show: true,
      color: '#4ADEFE', //X轴文字颜色
      fontSize: 12
    }
  },
  yAxis: [
    {
      type: 'value',
      name: '人数',
      nameTextStyle: {
        color: '#4ADEFE',
        fontSize: 12
      },
      splitLine: {
        show: true,
        lineStyle: {
          width: 1,
          color: '#4ADEFE'
        }
      },
      axisTick: {
        show: false
      },
      axisLine: {
        show: false
      },
      axisLabel: {
        show: true,
        color: '#4ADEFE',
        fontSize: 12
      }
    }
  ],
  series: [
    {
      name: '昨日总人数',
      type: 'bar',
      barWidth: 10,
      itemStyle: {
        color: {
          type: 'linear',
          x: 0, // 右
          y: 1, // 下
          x2: 0, // 左
          y2: 0, // 上
          colorStops: [
            {
              offset: 0,
              color: '#f3db5c' // 0% 处的颜色
            },
            {
              offset: 1,
              color: '#f3db5c' // 100% 处的颜色
            }
          ]
        }
      },
      data: [240, 145, 43, 35, 76, 154, 360, 42, 168]
    },
    {
      name: '今日实时人数',
      type: 'bar',
      barWidth: 10,
      itemStyle: {
        color: {
          type: 'linear',
          x: 0, // 右
          y: 1, // 下
          x2: 0, // 左
          y2: 0, // 上
          colorStops: [
            {
              offset: 0,
              color: '#4adefe' // 0% 处的颜色
            },
            {
              offset: 1,
              color: '#4adefe' // 100% 处的颜色
            }
          ]
        }
      },
      data: [133, 23, 114, 67, 89, 35, 67, 96, 90]
    }
  ]
});
</script>

<template>
  <div :style="{ width: '100%', height: '90%' }">
    <Echarts :option="option" />
  </div>
</template>
第二个案例同上
js"><script setup lang="ts">
import { reactive } from 'vue';
import Echarts from './index.vue';

const data = {
  "orderNum":[
    "39",
    "77",
    "96",
    "41",
    "24",
    "17",
    "0",
    "10"
  ],
  "categoryArr":[
    "订购附属",
    "新装",
    "拆机",
    "改客户资料",
    "补换卡",
    "过户",
    "换挡",
    "移机"
  ],
  "avgTime":[
    "10.79",
    "17.05",
    "14.84",
    "10.07",
    "5.58",
    "10.36",
    "0.00",
    "4.43"
  ],
  "legendArr":[
    "耗时时间",
    "订单量"
  ]
}
let maxOrder=Math.max.apply(null,data.orderNum);
const option = reactive({
  title : {text:'',subtext:'',top:'3',right:'0'},
  tooltip: {trigger: 'axis'},
  grid: {left: '8%',right: '8%',bottom: '10%'},
  xAxis: {
    type: 'category',
    axisLine: {
      lineStyle: {
        color: '#57617B'
      }
    },
    axisLabel: {
      interval:0,
      textStyle: {
        color:'#fff',
      }
    },
    data: data.categoryArr
  },
  yAxis:[
    {
      type: 'value',name: '',
      axisLine: {lineStyle: {color: '#57617B'}},
      axisLabel: {margin: 10,textStyle: {fontSize: 12},textStyle: {color:'#fff'},formatter:'{value}分'},
      splitLine: {show: false}
    },
    {
      type: 'value',name: '',max:maxOrder+parseInt(maxOrder*0.2),
      axisLabel: {margin: 10,textStyle: {fontSize: 12},textStyle: {color:'#fff'},formatter:'{value}笔'},
      splitLine: {
        show: true,
        lineStyle:{
          type:'dashed',
          color: ['#25CEF3']
        }
      }
    }
  ],
  series: [
    {
      name:'耗时时间',
      type:'line',
      yAxisIndex:0,
      smooth: false,
      symbolSize:5,
      lineStyle: { normal: {width: 2}},
      areaStyle: {
        normal: {
          color: {
            type: 'linear',
            x: 0,
            y: 0,
            x2: 0,
            y2: 1,
            colorStops: [
              {
                offset: 0,
                color: 'rgba(230, 48, 123, 0.8)'
              },
              {
                offset: 0.8,
                color: 'rgba(230, 48, 123, 0)'
              }
            ],
            globalCoord: false // 缺省为 false
          },
          shadowColor: 'rgba(0, 0, 0, 0.1)',
          shadowBlur: 10
        }
      },
      itemStyle: {normal: { color: '#DA2F78'}},
      data:data.avgTime
    },
    {
      name:'订单量',
      type:'bar',
      barWidth:12,
      yAxisIndex:1,
      itemStyle : {
        normal: {
          barBorderRadius:[10, 10, 0, 0],
          color: {
            type: 'linear',
            x: 0,
            y: 1,
            x2: 0,
            y2: 0,
            colorStops: [
              {
                offset: 0,
                color: "#4033F9"
              },
              {
                offset: 0.8,
                color: "#BA97F9"
              }
            ],
            globalCoord: false // 缺省为 false
          },
          shadowColor: 'rgba(0, 0, 0, 0.1)',
        }
      },
      data:data.orderNum
    }
  ]
});
</script>

<template>
  <div :style="{ width: '100%', height: '90%' }">
    <Echarts :option="option" />
  </div>
</template>