在微信小程序绘制折线图时,选择Echarts。官网如下:https://echarts.apache.org/zh/index.html
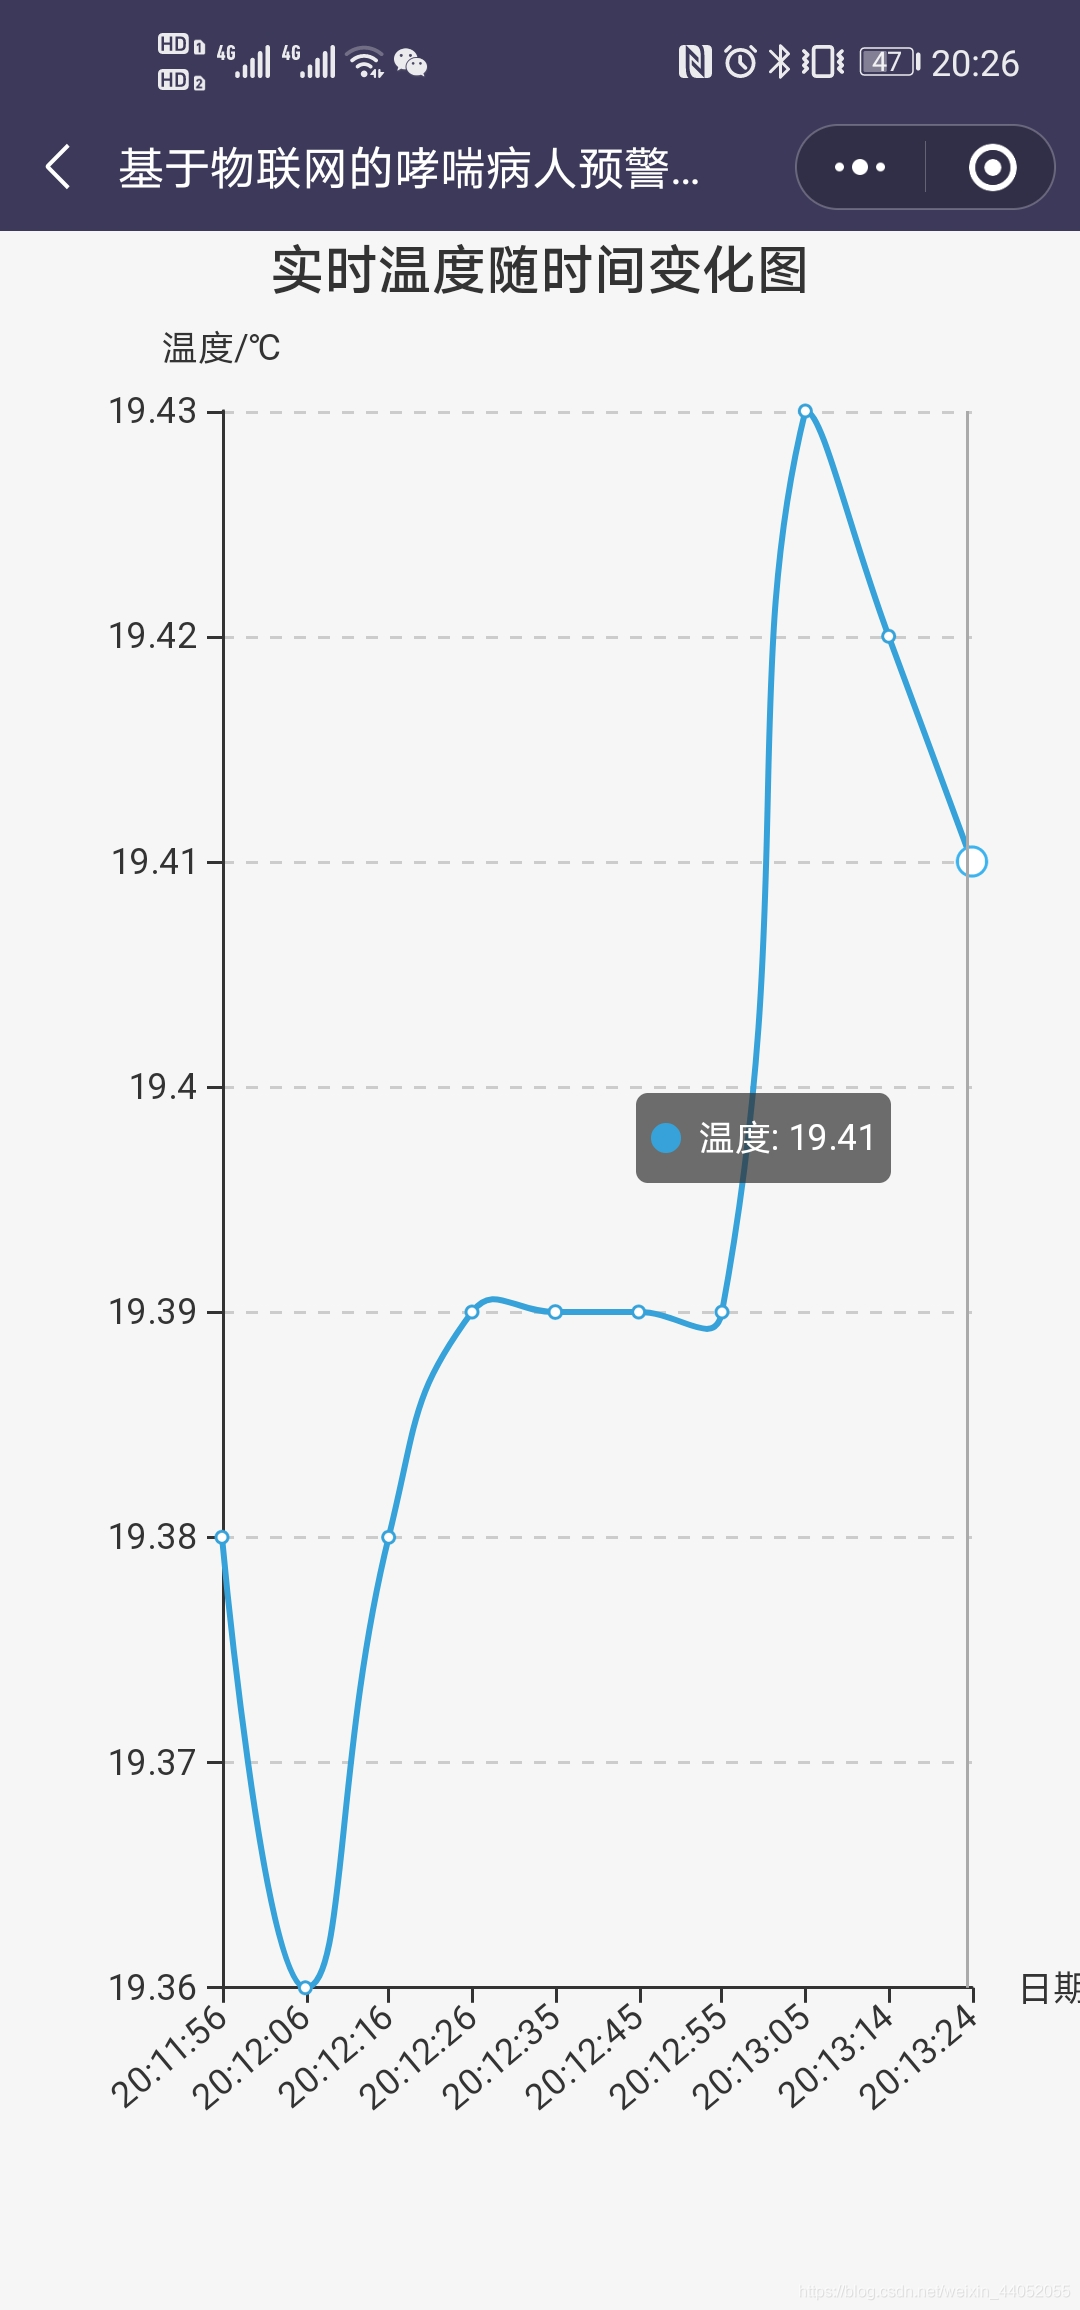
效果如下:(由于为截取动态图,只有实时图片结果)
微信小程序中的应用,就看在微信小程序中使用Echarts。
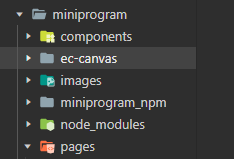
 主要就是拷贝 ec-canvas 目录到新建的小程序项目下,然后做相应的调整。
github链接如下:https://github.com/ecomfe/echarts-for-weixin
然后正式开始在小程序中使用Echarts。我的需求是绘制温度随时间变化的折线图,温度和时间从服务器中获取,因为数据是实时刷新的,我们是10秒刷新一次数据,因此我想让折线图也动态实时刷新,于是设置刷新时间,不断刷新从服务起取数据,进而不断重新绘制图形,达到实时刷新的效果。
1.引入Echarts
(1)将ec-canvas文件拷贝下来放到你自己的项目中:
(2)在你需要使用Echarts的页面的json文件中引入Echarts
{
  "usingComponents": {
    "ec-canvas": "../../ec-canvas/ec-canvas"
  }
}
2.使用Echarts
在需要显示图表的页面的wxml中使用Echarts。
<view class="containera">
  <ec-canvas id="mychart-dom-bar" canvas-id="mychart-bar" ec="{{ ec }}"></ec-canvas>
</view>
在wxss设置宽度和高度
ec-canvas {
  width: 100%;
  height: 100%;
}
注:如果页面有多张图表时,要调整高度。
jsEcharts_41">3.js页面设置Echarts以及动态刷新
现在是最重要的js交互代码。
(1)先引入:如官网所述,找到对应的文件夹。
import * as echarts from '../../ec-canvas/echarts';
(2)设置图的格式。这里我使用的是折线图。
我这里是想要画温度随时间变化的折线图。x轴数据和y轴数据是从服务器中取出来的。
function line_set(chart, xdata, ydata) { //xdata, ydata分别表示x轴数据和y轴数据
  var option = {
  // 设置图的title、xAxis、yAxis
    title: {
      text: '温度随时间变化图',
      left: 'center'
    },
    color: ["#37A2DA", "#67E0E3", "#9FE6B8"],

    grid: {
      containLabel: true
    },
    tooltip: {
      show: true,
      trigger: 'axis'
    },
    xAxis: {
      name:'日期',
      axisLabel: {  //因为日期太长,显示不全,于是让横坐标斜着显示出来
        interval:0,
        rotate:40
     } ,
      type: 'category',
      boundaryGap: false,
      data: xdata,  //xdata是服务器读取的数据
    },
    yAxis: {
      name:'温度/℃',
      x: 'center',
      type: 'value',
      splitNumber:5,
      min: 30,
      max: 40,
      splitLine: {
        lineStyle: {
          type: 'dashed'
        }
      }

    },
    series: [{
      name: '温度',
      type: 'line',
      smooth: true,
      data: ydata  // ydata也是服务器取出来的数据
    }]
  };
  chart.setOption(option);
}
设置page中的数据:
data设置图表的ec,以及动态刷新的时间间隔
data: {

    ec: {
      lazyLoad: true
    },
    timer:''
  },
onload函数设置调用的函数,以及设置动态刷新的函数
onLoad: function (options) {
    var _this = this;
    this.getOption();
    this.setData({                    //每隔10s刷新一次
      timer: setInterval(function () {
        _this.getOption();
    }, 10000)
    })
  },
对应的wxml中的ec-canvas id
onReady: function () {
    this.oneComponent = this.selectComponent('#mychart-dom-bar');
  },
初始化图表:
init_chart: function (xdata, ydata) {           //初始化图表
    this.oneComponent.init((canvas, width, height, dpr) => {
        const chart = echarts.init(canvas, null, {
            width: width,
            height: height,
            devicePixelRatio: dpr // new
        });
        line_set(chart, xdata, ydata)
        this.chart = chart;
        return chart;
    });
},
从服务器接口中读取数据:
getOption: function () {
  var _this = this;
  wx.request({
      url: 'https://*******/',    //你请求数据的接口地址
      method: 'GET',
      header: {
          "Content-Type": "application/json"
      },
      success: function (res) {
        console.log(res);
        _this.setData({
          //将接口返回的数据data赋值给data
          data:res.data,
        })
        //将读取的数据直接存储到list中,可以直接使用
        var temperature=[];
        var date=[];
        for (var i = 0; i < res.data.length; ++i) {
            temperature[i]=res.data[i].temperature;
            date[i]=res.data[i].date;
         }
        _this.init_chart(date,temperature)
     },
  })
},
完整代码如下:
import * as echarts from '../../ec-canvas/echarts';


function line_set(chart, xdata, ydata) {

  var option = {
    title: {
      text: '温度随时间变化图',
      left: 'center'
    },
    color: ["#37A2DA", "#67E0E3", "#9FE6B8"],

    grid: {
      containLabel: true
    },
    tooltip: {
      show: true,
      trigger: 'axis'
    },
    xAxis: {
      name:'日期',
      axisLabel: {
        interval:0,
        rotate:40
     } ,
      type: 'category',
      boundaryGap: false,
      data: xdata,
      // show: false
    },
    yAxis: {
      name:'温度/℃',
      x: 'center',
      type: 'value',
      splitNumber:5,
      min: 30,
      max: 40,
      splitLine: {
        lineStyle: {
          type: 'dashed'
        }
      }
      // show: false
    },
    series: [{
      name: '温度',
      type: 'line',
      smooth: true,
      data: ydata
    }]
  };
  chart.setOption(option);
}
Page({

  /**
   * 页面的初始数据
   */
  data: {

    ec: {
      lazyLoad: true
    },
    timer:''
  },

  /**
   * 生命周期函数--监听页面加载
   */
  onLoad: function (options) {
    var _this = this;
    this.getOption();
    this.setData({                    //每隔10s刷新一次
      timer: setInterval(function () {
        _this.getOption();
    }, 10000)
    })
  },
  /**
   * 生命周期函数--监听页面初次渲染完成
   */
  onReady: function () {
    this.oneComponent = this.selectComponent('#mychart-dom-bar');

  },
  onUnload: function () {
    clearInterval(this.data.timer)
},
  init_chart: function (xdata, ydata) {           //初始化第一个图表
    this.oneComponent.init((canvas, width, height, dpr) => {
        const chart = echarts.init(canvas, null, {
            width: width,
            height: height,
            devicePixelRatio: dpr // new
        });
        line_set(chart, xdata, ydata)
        this.chart = chart;
        return chart;
    });
},
getOption: function () {
  var _this = this;
  wx.request({
      url: 'https://******/',    //你请求数据的接口地址
      method: 'GET',
      header: {
          "Content-Type": "application/json"
      },
      success: function (res) {
        console.log(res);
        _this.setData({
          //将接口返回的数据data赋值给data
          data:res.data,
        })
        var temperature=[];
        var date=[];
        for (var i = 0; i < res.data.length; ++i) {
            temperature[i]=res.data[i].temperature;
            date[i]=res.data[i].date;
         }
        _this.init_chart(date,temperature)
      },
  })
},
这样就实现了实时动态刷新的效果,每隔10s重新画图。
希望对看到这篇博客的人有帮助。
